Documentation Index
Fetch the complete documentation index at: https://docs.evergreens.ai/llms.txt
Use this file to discover all available pages before exploring further.

What is Looker Studio?
For users who may not be familiar with it: Google Looker Studio (formerly Data Studio) is a free tool by Google that lets you create interactive dashboards and reports from your data. With the Tedi integration, you can visualize your AI Brand Monitor tool data - like brand visibility, sentiment, top sources, and more - in beautiful, shareable reports for your customers, executives, or team.Prerequisites
Before you start, make sure you have:A Tedi account
At least one project
Step 1: Connect Google Looker Studio in Tedi Dashboard
First, you need to connect your Google account to Tedi so Looker Studio can access your data.Open the Integrations page
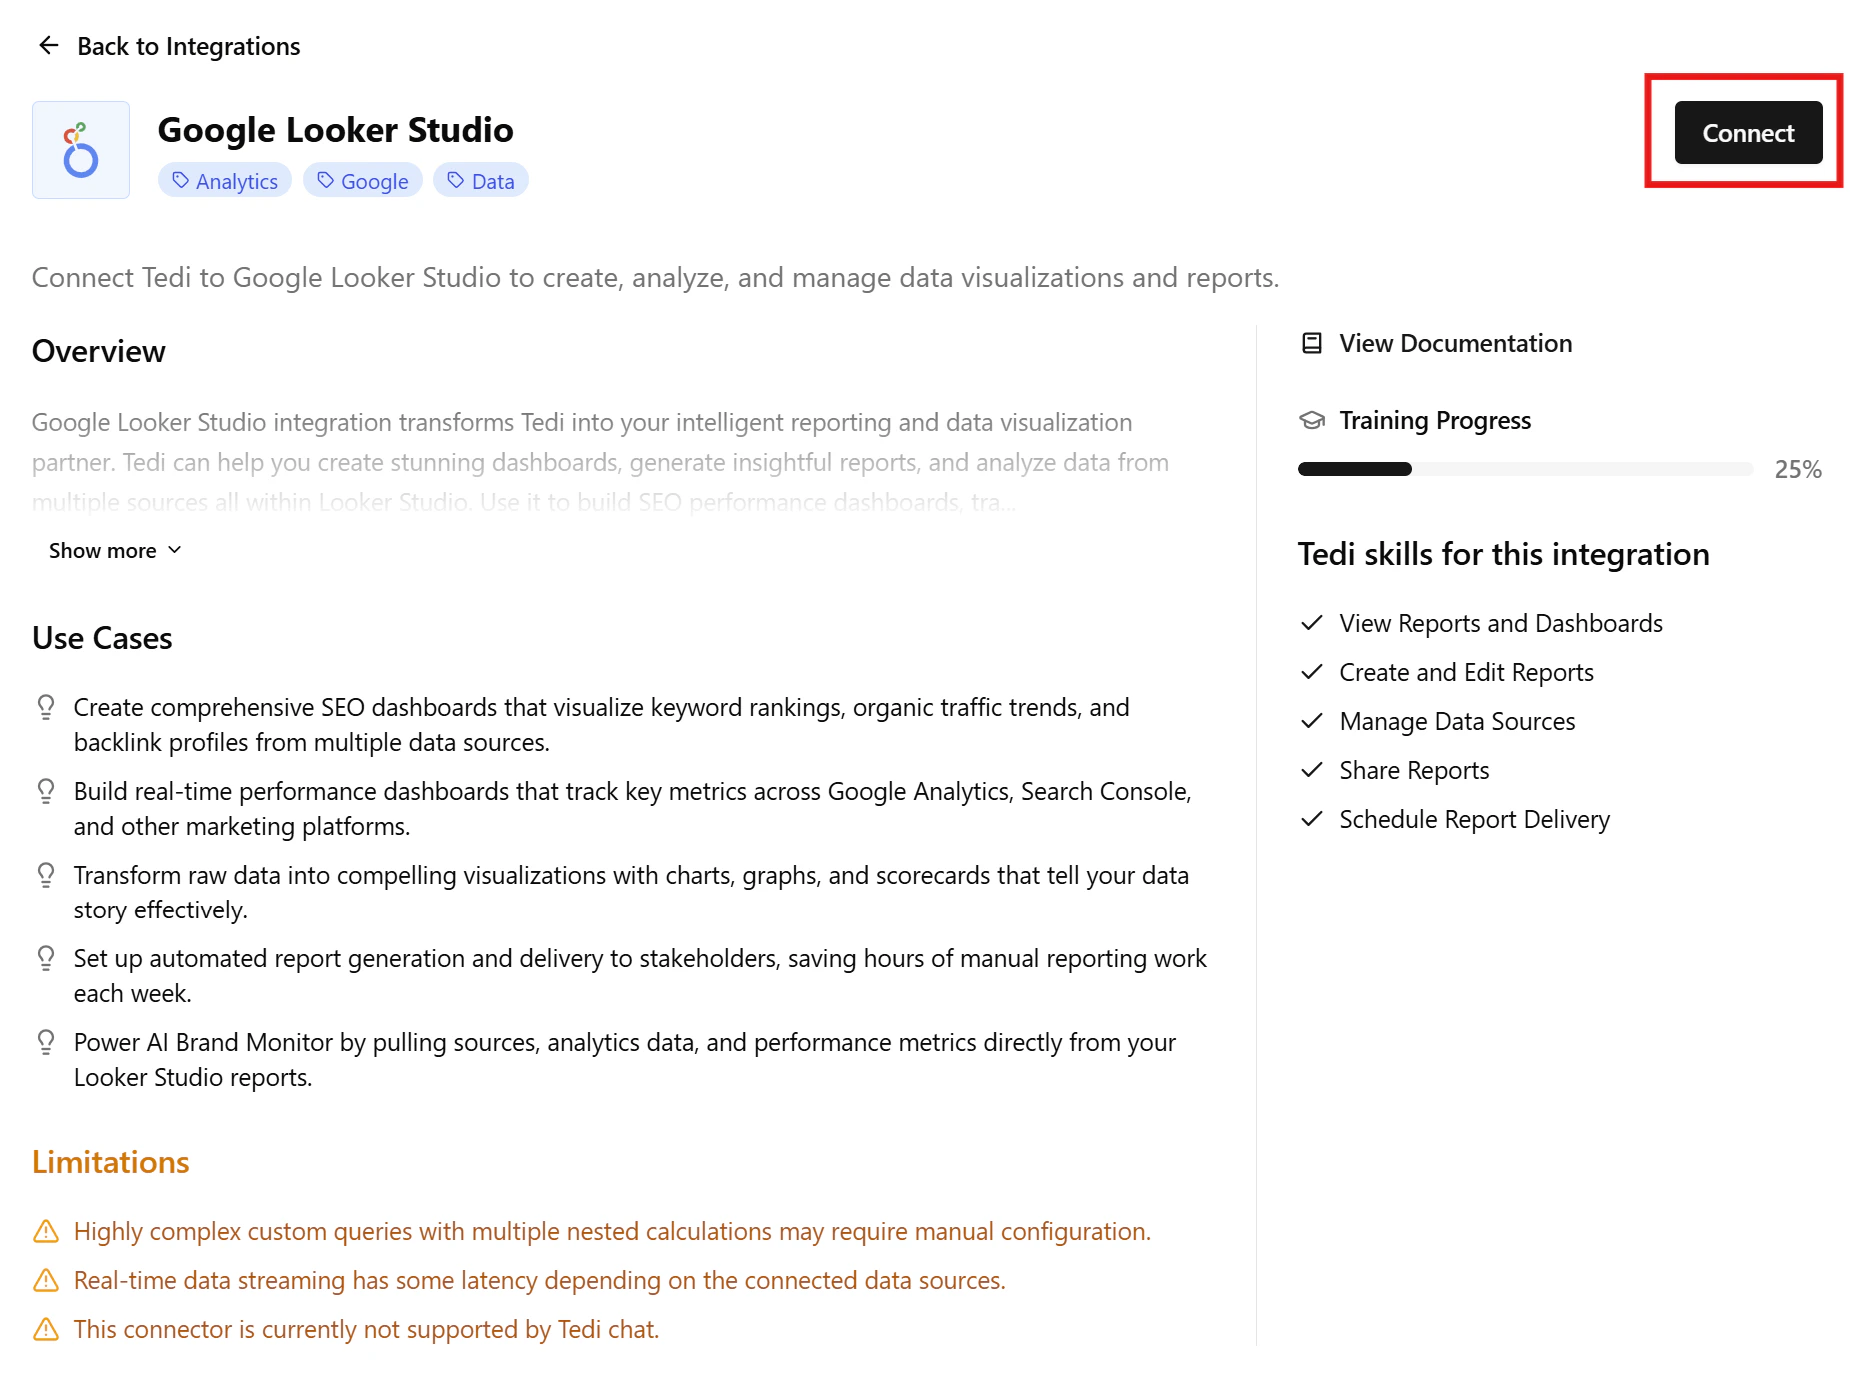
Sign in with Google
Grant permissions
Step 2: Open the Tedi Connector in Looker Studio
Now you can add Tedi as a data source in Looker Studio.Open the Project Settings
Navigate to Data Aggregation
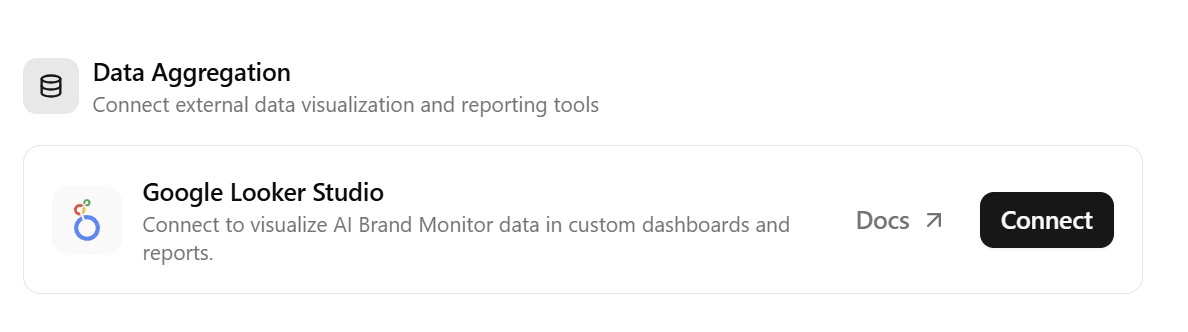
Connect Google Looker Studio
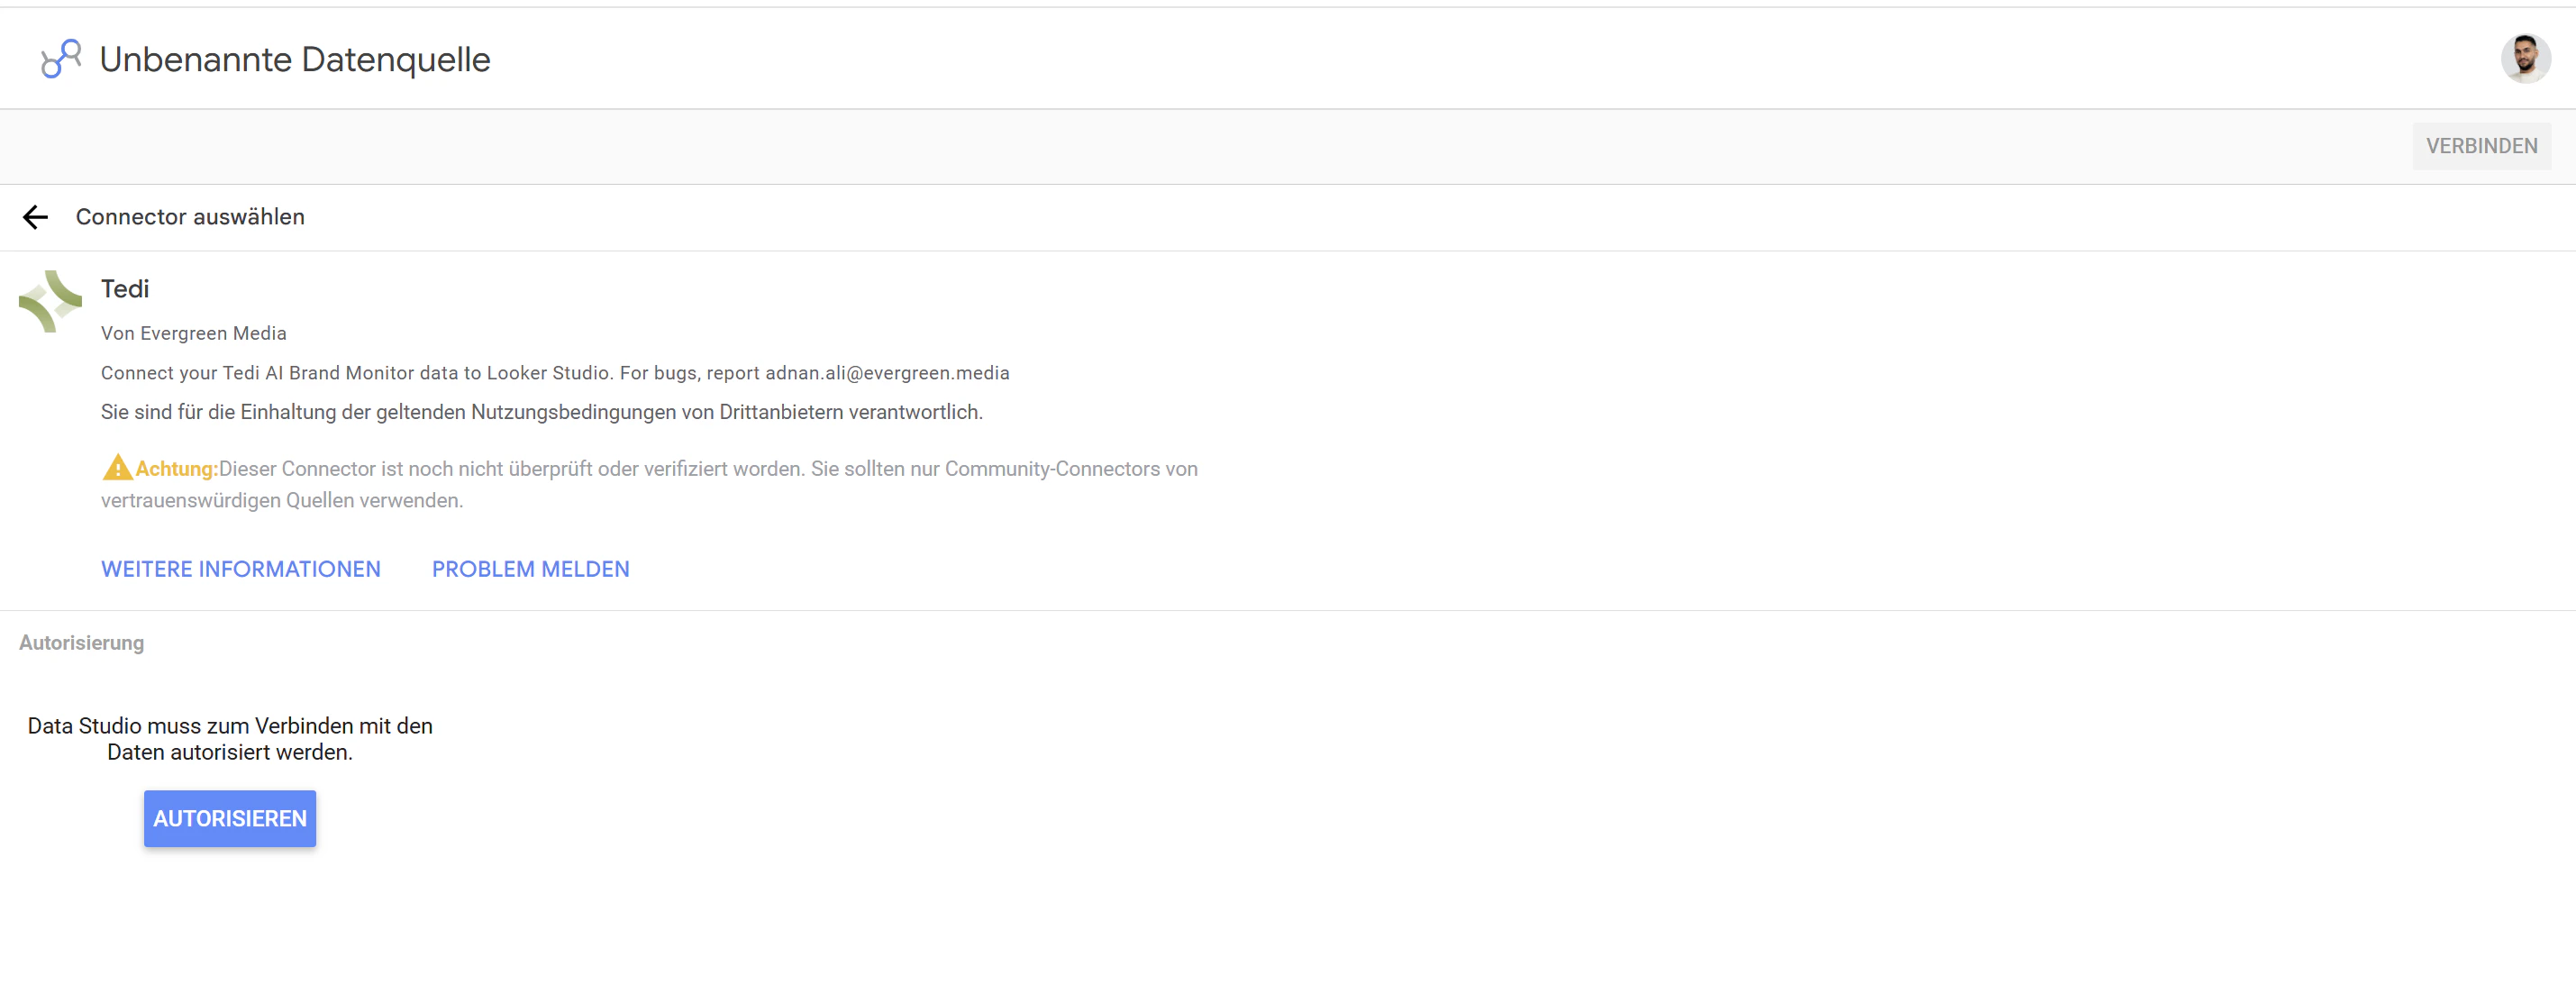
Authorize the connector
Step 3: Select Your Project and Data Type
After authorization, you’ll see the connector configuration screen.Select a Project
Select a Data Type
| Data Type | What it shows |
|---|---|
| Brand Performance | Per-day, per-brand, per-topic, per-tag breakdown. Best for flexible exploration with Topic/Tag dimensions. Percentages are pre-computed per bucket and aggregated via AVG in Looker may differ from the Tedi dashboard by a few percentage points. |
| Brand Visibility Daily | Per-day, per-brand, per-topic, per-platform raw numerator / denominator counters. Build percentages as SUM(num) / SUM(den) calculated fields to reproduce the Tedi Overview dashboard EXACTLY (1:1 parity). No Tag breakdown. |
| Top Sources (legacy) | Per-day source rows with URL, domain, topic and citation counts |
| Top Domains | Domain-level table matching the dashboard Sources > Domains view (Retrieved %, Retrieval Rate, Citation Rate) |
| Top URLs | URL-level table matching the dashboard Sources > URLs view (Retrievals, Citation Rate, Brand Mentioned) |
| Prompts Metrics | Performance data for each tracked prompt/question |
Step 4: Create Your Report
After connecting, Looker Studio will show you the available data fields.Review the fields
Click Create Report
Add charts and tables
- Line chart: Brand visibility over time (X = Date, Y = Visibility %, Breakdown = Brand)
- Bar chart / Table: Top brand rankings (Dimension = Brand, Metric = Visibility %, sorted descending)
- Bar chart: Top sources by citations
- Scorecard: Total chats this month
- Table: All prompts with Visibility, Sentiment, Position
- Pie chart: Share of voice across brands
Topic and Tags so viewers can slice the dashboard.Available Data Fields
Brand Performance
Used for the Visibility line chart and Brand Rankings views.| Field | Type | Description |
|---|---|---|
| Date | Dimension | Date of the data point |
| Project Name | Dimension | Name of your Tedi project |
| Brand | Dimension | The brand being tracked |
| Topic | Dimension | Topic of the prompt (e.g. Branded, Non-Branded). null if the prompt has no topic. |
| Tag | Dimension | Tag of the prompt. Prompts with multiple tags appear once per tag; prompts without tags have Tag = null. |
| Visibility % | Metric | % of AI chats mentioning the brand (0–100), recomputed per (Topic, Tag) bucket |
| Visibility Δ | Metric | Change in visibility vs. previous day (same Topic, Tag) |
| Share of Voice % | Metric | Brand’s share of mentions among all tracked brands (0–100), recomputed per (Topic, Tag) bucket |
| Share of Voice Δ | Metric | Change in share of voice vs. previous day (same Topic, Tag) |
| Sentiment | Metric | Sentiment score (0–100, higher is more positive) |
| Sentiment Δ | Metric | Change in sentiment vs. previous day (same Topic, Tag) |
| Average Position | Metric | Average position in AI responses (lower is better) |
| Position Δ | Metric | Change in position vs. previous day (same Topic, Tag) |
| Mention Count | Metric | Number of times the brand was mentioned |
| Chats | Metric | Number of AI chats/responses analyzed |
(Topic, Tag) bucket
matching exactly what the Tedi dashboard shows when you apply the same
Topic/Tag filter. Add Topic and Tag to the Filter section of your
chart, bind them to filter controls on the canvas, or drop them straight
into Dimensions for full breakdowns.AVG aggregation, so
when you drop them into a chart Looker automatically averages across the
multiplied tag rows multi-tag prompts no longer inflate the numbers. You
can switch the aggregation in the chart’s Metric badge (AVG → MAX,
MIN, SUM, …) if you need a different view.Brand Visibility Daily (matches Tedi Dashboard 1:1)
Use this data source whenever you need a KPI scorecard that must match the Tedi Overview dashboard exactly. It returns raw integer counters instead of pre-computed percentages, so Looker can re-aggregate them correctly when you slice by date, topic or platform.| Field | Type | Description |
|---|---|---|
| Date | Dimension | Date of the data point |
| Project Name | Dimension | Name of your Tedi project |
| Brand | Dimension | The tracked brand. Every chart MUST filter to one brand. |
| Topic | Dimension | Topic of the prompt (e.g. Branded, Non-Branded). null if no topic. |
| Platform | Dimension | AI platform / model that ran the chat (e.g. chatgpt, ai-mode) |
| Chats With Brand | Metric | Numerator for Visibility chats in the bucket where the brand was mentioned |
| Total Chats | Metric | Denominator for Visibility total successful chats in the bucket (repeats per brand row) |
| Brand Mentions | Metric | Numerator for Share of Voice brand-mention rows for this brand |
| Total Mentions | Metric | Denominator for Share of Voice mention rows across all brands (repeats per brand row) |
| Sentiment Sum | Metric | Sum of sentiment scores for this brand’s mentions |
| Sentiment Count | Metric | Count of non-null sentiment scores |
| Position Sum | Metric | Sum of per-chat MIN(position) for this brand |
| Position Count | Metric | Count of per-chat positions contributing to Position Sum |
Calculated fields copy/paste into Looker Studio
Create these as Berechnete Felder on the data source. They reproduce the Tedi dashboard math exactly (chat-weighted ratio over the period). Visibility %AVG and may differ by a few percentage points).Top Sources (legacy)
| Field | Type | Description |
|---|---|---|
| Date | Dimension | Date of the data point |
| Project Name | Dimension | Name of your Tedi project |
| URL | Dimension | Full URL of the source |
| Source: Domain | Dimension | Domain name of the source (e.g. example.com) |
| Source Type | Dimension | Type of source (news, repository, social, …) |
| Topic | Dimension | Topic associated with this source |
| Tags | Dimension | Comma-separated list of tags |
| AI Platforms | Dimension | AI platforms that cited this source |
| Citations | Metric | Number of distinct chats that cited this source (safe to SUM) |
| Used in % of Chats | Metric | % of all AI chats in the period that cited this domain/URL (0–100) |
| Avg. Citations per Appearance | Metric | Average citation_count when this source appears in a chat |
Top Domains
Mirrors the Sources → Domains table in the Tedi dashboard exactly. Each row is one domain aggregated over the selected date range.| Field | Type | Description |
|---|---|---|
| Project Name | Dimension | Name of your Tedi project |
| Domain | Dimension | Domain name (e.g. reddit.com) |
| Domain Type | Dimension | Source classification: UGC, Editorial, Corporate, You, Competitor, … |
| Retrieved % | Metric | % of all AI chats where this domain appeared matches dashboard Retrieved % |
| Retrieval Rate | Metric | Avg. unique URLs from this domain per chat (> 1 = AI pulls multiple pages) |
| Citation Rate | Metric | Avg. citations per chat that used this domain matches dashboard Citation Rate |
| Total Retrievals | Metric | Total number of chats that cited this domain (safe to SUM) |
| Total Citations | Metric | Total citation_count across all appearances (safe to SUM) |
Top URLs
Mirrors the Sources → URLs table in the Tedi dashboard exactly. Each row is one URL aggregated over the selected date range.| Field | Type | Description |
|---|---|---|
| Project Name | Dimension | Name of your Tedi project |
| URL | Dimension | Full URL of the source |
| Page Title | Dimension | Title of the page |
| Domain | Dimension | Domain extracted from the URL |
| Domain Type | Dimension | Domain classification: UGC, Editorial, Corporate, … |
| URL Type | Dimension | URL classification: Listicle, Article, Forum, … |
| Own Brand Mentioned | Dimension | Yes / No whether your own brand appears in chats that cite this URL |
| Retrievals | Metric | Number of chats that cited this URL matches dashboard Retrievals (safe to SUM) |
| Citation Rate | Metric | Avg. citations per chat that used this URL matches dashboard Citation Rate |
Prompts Metrics
Used for the Prompts table view, shows per-prompt performance for the tracked own brand.| Field | Type | Description |
|---|---|---|
| Date | Dimension | Date of the data point |
| Project Name | Dimension | Name of your Tedi project |
| Prompt | Dimension | Full prompt/question text |
| Brand | Dimension | The own brand being tracked for this prompt |
| Topic | Dimension | Topic assigned to the prompt (e.g. Branded, Non-Branded) |
| Tags | Dimension | Comma-separated list of tags assigned to the prompt |
| Status | Dimension | Prompt status (active, paused, …) |
| AI Platform | Dimension | AI platform (ChatGPT, Perplexity, Gemini, …) |
| Visibility % | Metric | Visibility score for this prompt (0–100) |
| Sentiment | Metric | Sentiment score for this prompt (0–100) |
| Average Position | Metric | Average brand position for this prompt |
| Response Volume | Metric | Number of AI responses for this prompt |
Adding Date Filters
The Tedi connector supports date range filtering. To add a date filter to your report:- Click “Add a control” in the Looker Studio toolbar
- Select “Date range control”
- Place it on your report
- Now report viewers can filter all charts by date range
Filtering by Topic, Tag & Platform
Topic, Tag and Platform are exposed as real dimensions (depending on
the data source), so all native Looker Studio filter UX works out of the box.
| Field | Brand Performance | Brand Visibility Daily |
|---|---|---|
Topic | ✅ | ✅ |
Tag | ✅ | ❌ (would break SUM/SUM math) |
Platform | ❌ | ✅ |
| Use case | What to do |
|---|---|
| Break down a table | Drag Topic / Tag / Platform into the chart’s Dimension section |
| Filter one chart | Chart properties → Filter → + Add a filter → field = Topic / Tag / Platform / Brand, condition = Equal to (=), value = the exact name |
| Page-level filter dropdown | Toolbar → Add a control → Drop-down list → bind it to the field viewers can then pick values themselves |
| Page-level filter input box | Toolbar → Add a control → Input box useful for free-text matches |
Payroll, HR → rows tagged with either).Sharing Your Report
Once your dashboard is ready, you can share it with your team:- Click the “Share” button (top right)
- Add email addresses of people you want to share with
- Choose “Viewer” or “Editor” access
- Click “Send”
Refreshing Data
Looker Studio automatically refreshes data when the report is opened. You can also:- Click the refresh icon in the toolbar to manually refresh
- Set up scheduled email delivery to automatically send report snapshots
Troubleshooting
I see 'Could not load projects' error
I see 'Could not load projects' error
I see 'No projects found' error
I see 'No projects found' error
The Project dropdown is empty
The Project dropdown is empty
I get 'Bad Request Error 400' when authorizing
I get 'Bad Request Error 400' when authorizing
I get redirect loops or 'too many redirects'
I get redirect loops or 'too many redirects'
My data looks outdated
My data looks outdated
My Brand Visibility Daily scorecard shows ~9 % or ~23 % instead of the real number
My Brand Visibility Daily scorecard shows ~9 % or ~23 % instead of the real number
Total Chats and Total Mentions REPEAT across every brand row
for the same (Date, Topic, Platform) bucket. If your chart doesn’t filter
to one specific brand, the denominator sums across all tracked brands and
your percentage falls to roughly 1 / num_brands (e.g. ~9 % with 11
brands).Fix pick one of these:-
Chart-level filter: chart properties → Filter section → add
Brand = Livv(exact spelling, case-sensitive). Verify the filter chip appears after saving it sometimes silently fails to attach. -
Page-level filter control: toolbar → Add a control → Drop-down
list → bind to
Brand, set default = your brand name. -
Bake the brand into the formula (immune to forgotten filters):
Brand and Metric = Visibility %. Every row should show that brand’s
correct percentage. If they all show ~9 %, the formula or aggregation is
set wrong; if your brand’s row shows the right number, the original
scorecard just needs the filter applied.My Topic / Tag filter returns no data
My Topic / Tag filter returns no data
Topic and Tag values are matched exactly (case-sensitive). Common
causes:- Typo or wrong casing.
branded≠Branded. Copy the name from the Tedi dashboard (Topics page or Prompt Tags) to be safe. - Stale cache after editing. Data is cached for 5 minutes change the filter, click the refresh icon, and wait up to a minute.
- Wrong project selected. The names exist in a different project than the one you connected.
- Looking at
null? Prompts with no topic (or no tag) produce rows withTopic = null/Tag = null. Filter tonullto see only those, or excludenullto hide them.
My `Chats` total is too high after adding `Tag`
My `Chats` total is too high after adding `Tag`
Chats or
Mention Count across tag rows double-counts those prompts.Fix: remove Tag from the chart Dimensions (group by Brand only) to
get the correct project-wide total. Visibility / SOV / Sentiment / Position
are unaffected they’re recomputed inside each bucket.I need help
I need help