Documentation Index
Fetch the complete documentation index at: https://docs.evergreens.ai/llms.txt
Use this file to discover all available pages before exploring further.

Overview
AI Brand Monitor tracks several key metrics that help you understand how AI platforms perceive and recommend your brand. This guide explains each metric and how to interpret the numbers.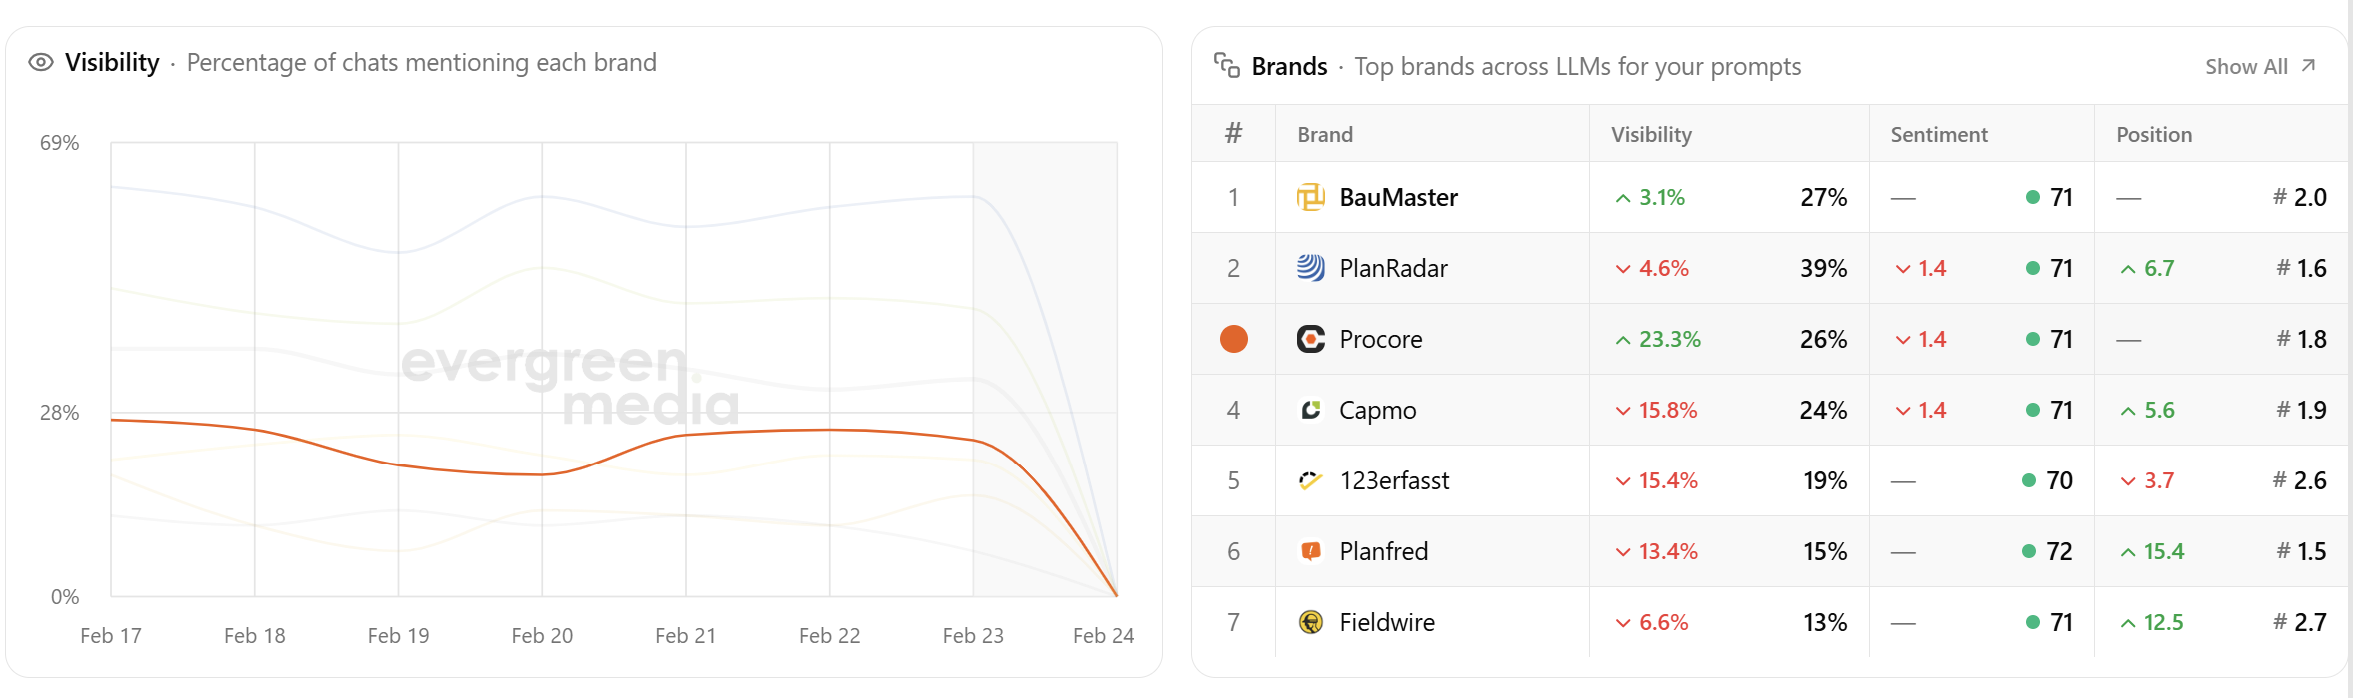
Visibility Score
What it measures: How often your brand is mentioned when AI platforms answer relevant questions.How It’s Calculated
Example Calculation
Example Calculation
If you have 100 prompts and your brand appears in 75 responses:
Interpreting Visibility
| Score | What It Means | What to Do |
|---|---|---|
| 80-100% | Excellent - AI consistently recommends you | Maintain your content strategy |
| 50-79% | Good - You appear in most conversations | Identify and fill gaps |
| 25-49% | Fair - Room for improvement | Analyze where competitors beat you |
| 0-24% | Low - AI rarely mentions you | Focus on content and SEO |
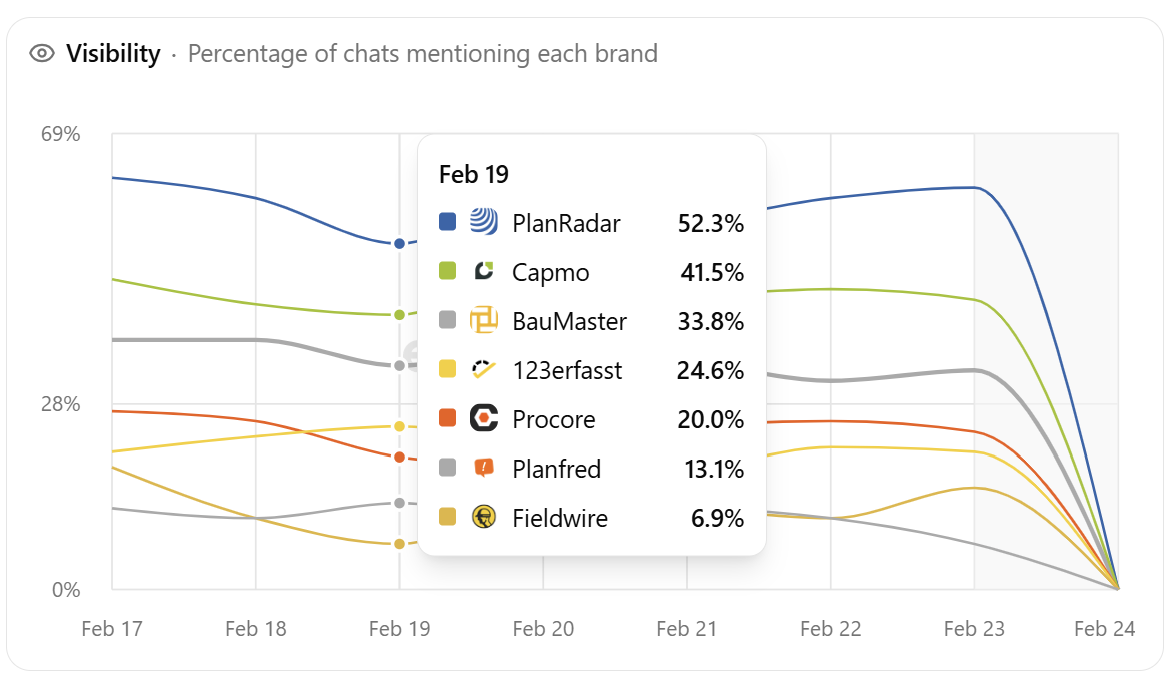
Visibility Chart
Your Brand Line
Usually green - this is your visibility trend
Competitor Lines
Shows how competitors are performing
Crossing Lines
Indicates competitive shifts happening
- Steady upward trend = Your efforts are working
- Sudden drop = AI models may have updated - check recent changes
- Gap widening = Competitors gaining ground
Sentiment Score
What it measures: How positively AI platforms describe your brand when they mention it.The Scale
| Score | Sentiment | What AI Says |
|---|---|---|
| 80-100 | Very Positive | Strong recommendations, highlights strengths |
| 60-79 | Positive | Generally favorable with minor caveats |
| 40-59 | Neutral | Factual mentions without strong opinion |
| 20-39 | Negative | Points out weaknesses or limitations |
| 0-19 | Very Negative | Warns against or criticizes |
Example Responses by Sentiment
High Sentiment (85)
High Sentiment (85)
“I highly recommend [Your Brand] for small businesses. It’s known for excellent customer support and intuitive design.”
Neutral Sentiment (50)
Neutral Sentiment (50)
“[Your Brand] is one option in this space. It offers standard features similar to competitors.”
Low Sentiment (25)
Low Sentiment (25)
“While [Your Brand] exists, many users report issues with pricing and limited integrations. You might want to consider alternatives.”
Improving Sentiment
Average Position
What it measures: Where your brand typically appears in AI recommendation lists.Interpretation
| Position | What It Means |
|---|---|
| 1.0 - 1.5 | Usually mentioned first - top of mind |
| 1.5 - 3.0 | Mentioned early - strong contender |
| 3.0 - 5.0 | Mentioned later - one of several options |
| 5.0+ | Mentioned last - afterthought |
Why Position Matters
Users often stop reading after the first few recommendations. Being mentioned first or second dramatically increases the chance users will consider you.Position Change
- Negative change = Improvement (moving up the list)
- Positive change = Decline (moving down the list)
Example
Example
Position changed from 3.2 to 2.5 = -0.7 (improvement!)You moved up about half a position in the average recommendation list.
Trend Indicators
What They Mean
| Indicator | Meaning |
|---|---|
| ↑ Up (Green) | Metric improved compared to the previous period (e.g., the last 7 days, based on applied filters) |
| ↓ Down (Red) | Metric declined compared to the previous period (e.g., the last 7 days, based on applied filters) |
Change Percentage
The percentage shows how much the metric changed:- Visibility +5.2% = You went from 70% to 75.2% visibility
- Sentiment -3.0 = Your sentiment dropped from 75 to 72
- Position -0.5 = You moved up half a position (improvement)
Share of Voice
What it measures: What percentage of all brand mentions belong to you vs. competitors.Calculation
Example Calculation
Example Calculation
If AI platforms made 500 brand mentions total:
- Your brand: 200 mentions
- Competitor A: 180 mentions
- Competitor B: 120 mentions
Why It Matters
Share of Voice shows your competitive standing within your tracked prompts. High visibility is good, but if competitors have higher visibility, your share of voice will be lower.
Using Metrics Effectively
Regular Review Schedule
Daily
Quick check of visibility trends and any alerts
Weekly
Review detailed metrics, check for significant changes
Monthly
Deep analysis, compare to goals, plan actions
Quarterly
Strategic review, report to stakeholders